As part of our Data Governance series, this month we’re taking a look at Energy breakdown reporting. As manufacturing sites are utilising and analysing more data than ever before, many companies are choosing to create Energy Breakdown reports using tools such as Carbon Desktop.
Energy Breakdown reports help you to easily visualise complex processes
Energy Breakdown reports are a visual tool that breaks down complex manufacturing processes, facilities, or industrial complexes into smaller, more manageable components, making it easier to identify areas for improvement and benchmark day to day performance.
This provides our clients with a clear and structured approach on how to analyse energy and water use across different processes, departments, or machines.
To create this, utility usage needs to be broken down into multiple levels, starting from high-level categories such as total energy consumption, down to more detailed sub-categories like lighting, industrial equipment, electrical systems, and production lines.
Each separation of the breakdown represents a distinct energy and water consuming department or line process such as Utilities, Production, and Process.
Our clients can then decide how to translate this breakdown against their energy and water data trends on Carbon Desktop to give example outputs such as:
- Benchmarking similar components: Once operation is refined into smaller parts it’s straight forward to compare comparable components, for example Line Compressed Air consumption per unit produced.
- Contextualising operational process: For changeable industrial processes seeing how the intensity of the energy breakdown changes from product A to product B
- Identifying areas of attention: Assigning target utility consumption for each area and should there be a non-conformance the area is drilled down to its lowest level to find the cause.
Best practices for creating a decomposition diagram for energy consumption
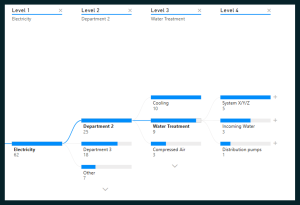
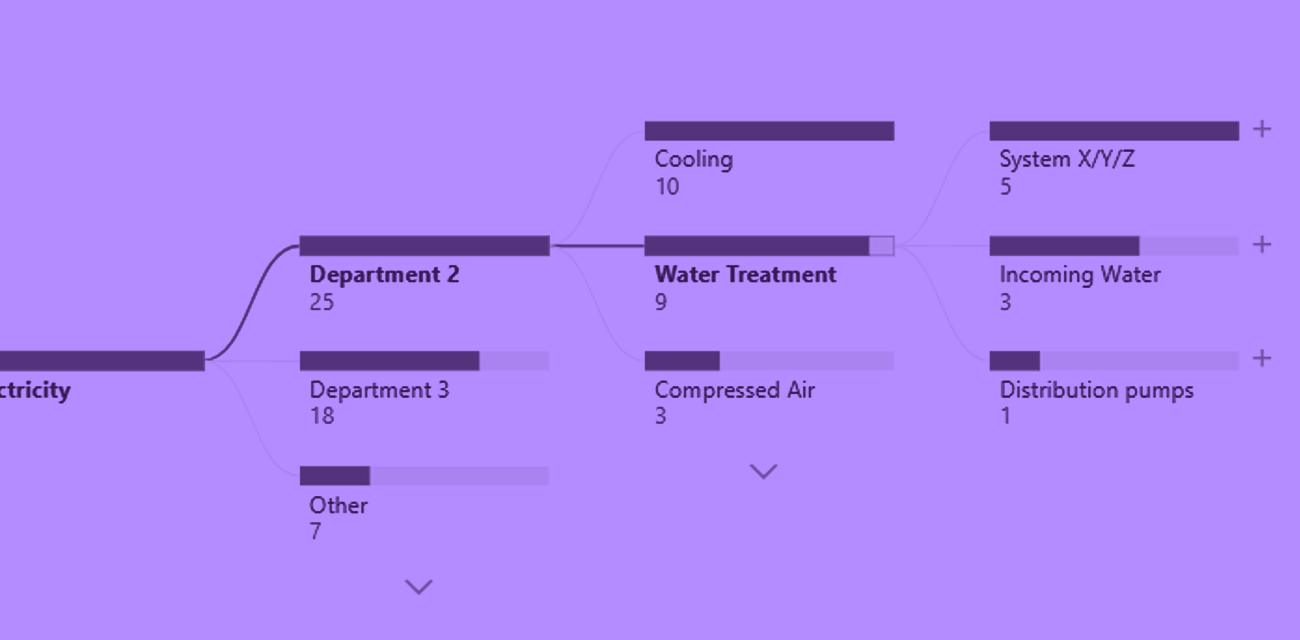
To make the most out of a decomposition diagram, as shown in figure 1, here are some key best practices to follow:
- Data Collection: Gather accurate and detailed energy data for all aspects of the manufacturing process. This may include manual energy meter readings and logbooks of key equipment such as boilers to build up the picture (manual data can later be automated within Carbon Desktop).
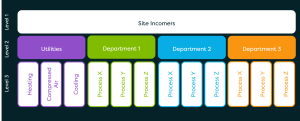
- Categorise Components: Break down the diagram into logical categories that represent different parts of the production process, such as energy use by machinery, equipment, lighting etc as shown in Figure 2:
- Regular Updates: Continuously monitor energy consumption and update the diagram regularly to ensure it remains relevant as new insight is leveraged from the breakdown.
Take a look at other articles in this series:
Detect missing readings: Identify problems and make savings
Detect missing readings: Case studies
Exception alerting: What it is and why you need it