Following our previous article which gave an overview of missing readings and why governance of missing readings is important, we’ve put together some case study examples of how governance of missing readings might be applied to the real world.
Transformer Dropout
For one of our clients, understanding consumption underneath their HV supplied electricity via LV transformer metering was a mandatory requirement. This has allowed them to track incomer consumption on a real-time basis whereas Electricity data from their supplier typically has an unaccommodating latency of 2 days.
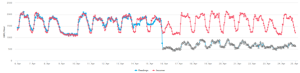
When looking at the blue readings of the LV transformer sub-meters there was a close alignment to the HV supplied consumption in red until the 11th April. At this point 2 of the transmitters on the transformers began to fail first sending average readings until dropping out all together on the 16th April.
As the remaining transformers transmitters were still working the blue readings line then falsely stated a lower consumption which could have confused reporting and trend analysis.
Fortunately, the missing readings report and then trend markers (white triangles) seen in the image above, were used to report to site that the readings trend had missing readings.
Site were then able to filter the report via data provider to see that it was a transmitter which had run out of battery which could be easily replaced.
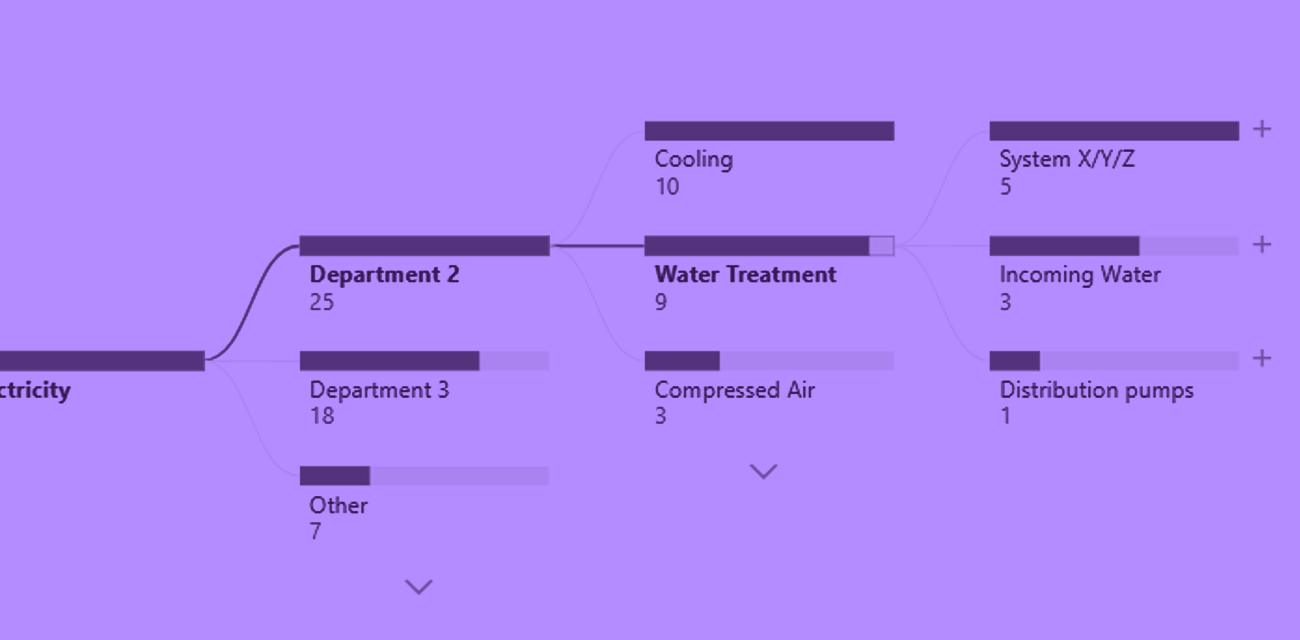
Summary of Data Providers
For sites with multiple data collection systems and providers it is very helpful to cluster meter dropouts into this category. This allows for the user to understand and pinpoint which system has data quality issues rather than which meters.
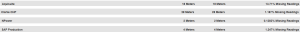
A typical report would show meter by meter what the expected readings are and how many are missing giving a percentage. However, without applying the data provider context its difficult to see first hand if the dropouts are linked.
The example report below shows that when you apply this categorisation the site can detect that the Aquisuite system has the largest number of missing readings ~15% and should have the resolution focus over systems with ~1% missing readings even if they have more meters.
Not Fully Monitoring System
In this example the site did not fully monitor their Air Compressor system due to a metering fault on their lead VSD marked in Green.
Previously site had the theory that the system did not run during the weekends and evenings and that the purple compressor led most of the consumption.
Once this metering fault was resolved site could see that this hypothesis was incorrect and that they had their air compressor system running 24/7.
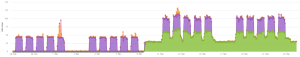
As the site used the missing readings report and markers, they were given an indication that the trend they were seeing didn’t fully capture the true operation of the unit and that any operational understanding was simply guesswork.
Take a look at other articles in this series:
Detect missing readings: Identify problems and make savings
Exception alerting: What it is and why you need it